Analysed 1M+ tweets from the 2020 US Presidential Election to predict candidate sentiment using NLP models including VADER, RoBERTa, and TextBlob.
The Goal
Can Twitter predict an election? The goal of this project was to analyse over a million tweets tagged #DonaldTrump and #JoeBiden from the 2020 US Presidential Election to determine which candidate had stronger public sentiment — and build a pipeline to classify that sentiment automatically.
Data & Preprocessing
The dataset consisted of two large CSV files containing tweets scraped from Twitter during the lead-up to the 2020 election. After merging the datasets, we filtered to US-only tweets, dropped nulls and duplicates, and applied a custom text cleaning pipeline.
The cleaning process involved stripping URLs, mentions, and special characters, converting to lowercase, and applying lemmatisation using NLTK's WordNetLemmatizer while removing stop words. This produced a clean cleantext column used for all downstream modelling.
Sentiment Models: VADER, RoBERTa & TextBlob
We benchmarked three NLP sentiment models against a manually labelled ground truth:
VADER — A lexicon-based model tuned for social media. Fast and interpretable, it classifies tweets as positive, negative, or neutral using a compound score threshold.
RoBERTa (cardiffnlp/twitter-roberta-base-sentiment) — A transformer model pre-trained on Twitter data. Applied in batches using PyTorch for efficiency.
TextBlob — A simpler polarity-based model that returns a float between -1 and 1.
All three were evaluated against a hand-labelled sample of 60 tweets (20 per sentiment class) using accuracy scores and confusion matrices.
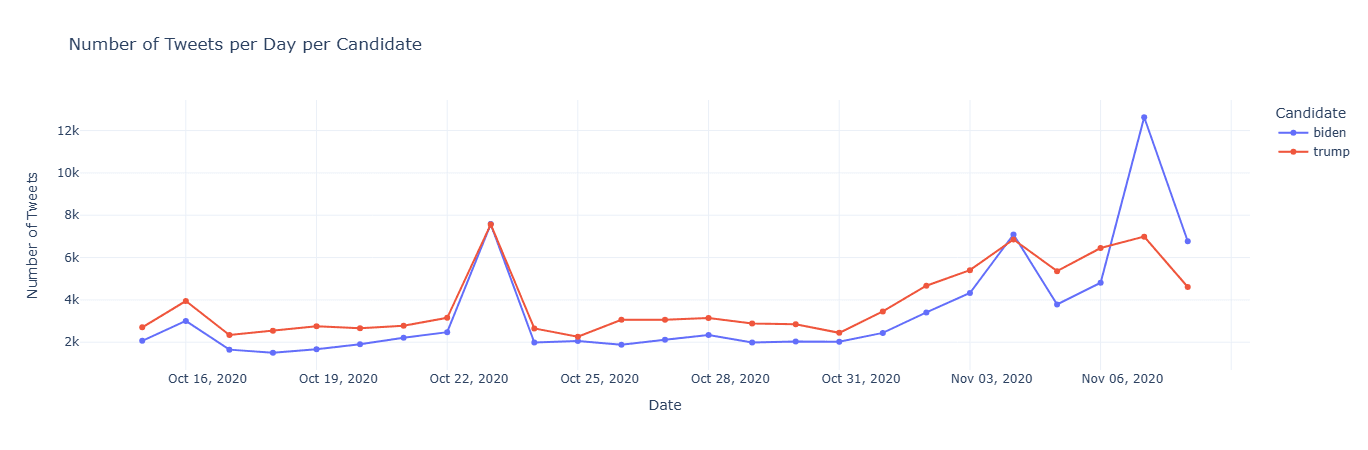
Tweet Volume Over Time
Plotting daily tweet counts for both candidates revealed a clear spike around October 22nd — the date of the final presidential debate — where Trump-tagged tweets peaked at ~8k in a single day. The most dramatic moment came on November 6th, two days after election day, when Biden tweets surged to over 12k as major networks called the race. Trump volume remained elevated but lower, reflecting the public's anticipation of the result.
State-Level Sentiment Maps
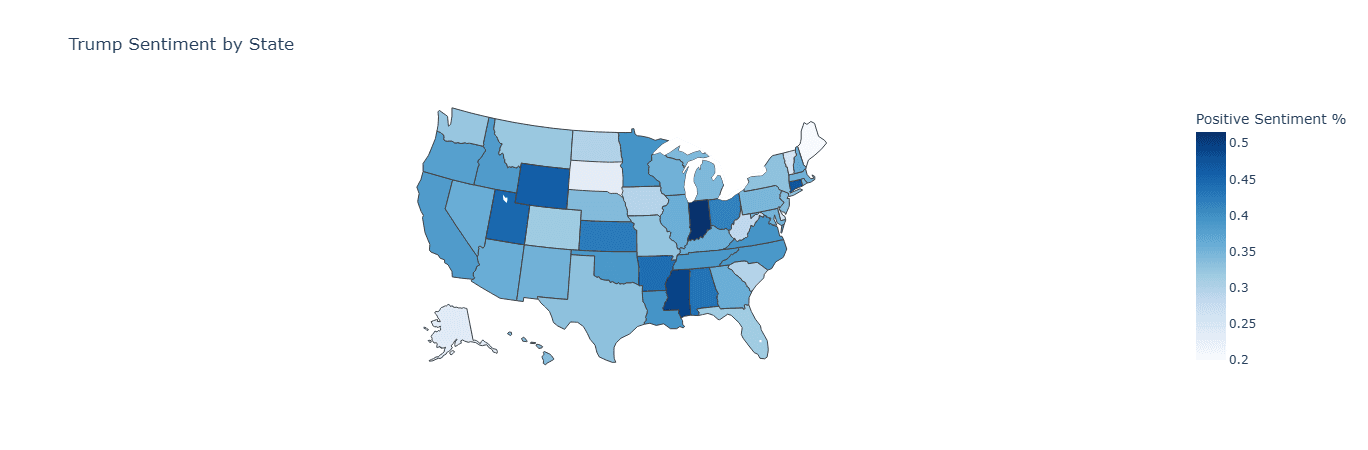
Using Plotly choropleth maps, we visualised positive sentiment percentage by state for each candidate.
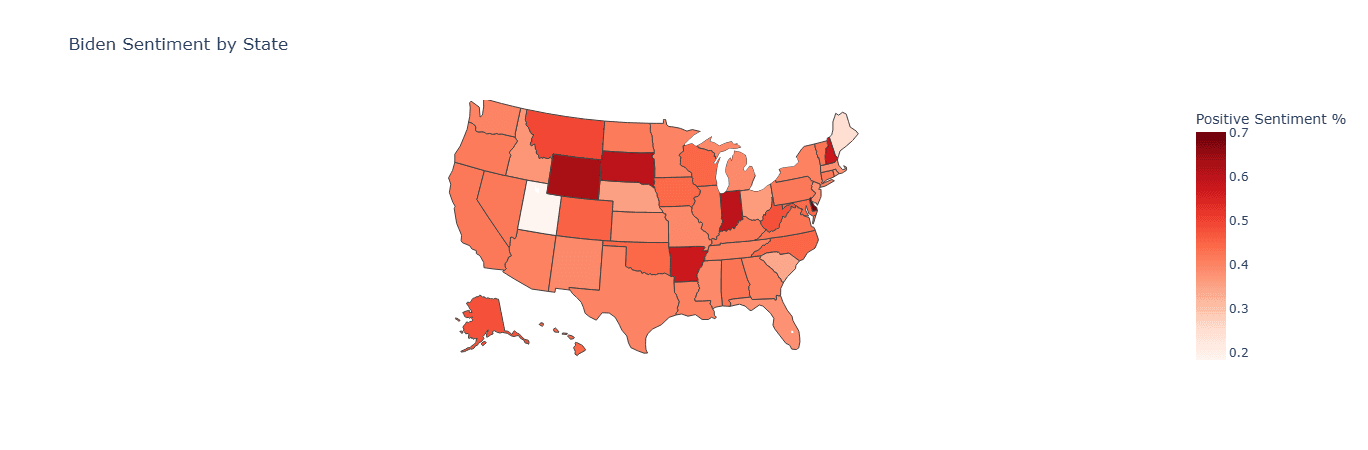
The Biden map (red scale) showed surprisingly high positive sentiment in traditionally Republican states like Wyoming, Arkansas, and South Dakota — likely due to low tweet volume making individual positive tweets disproportionately impactful.
The Trump map (blue scale) showed more uniform sentiment distribution nationally, with positive sentiment peaking in Mississippi, Indiana, and Utah.
Biden Sentiment by State
The Biden choropleth on its own shows the contrast more clearly — Montana, Wyoming and New Hampshire registered the highest positive sentiment percentages for Biden tweets, while several Southern states showed lower positive rates. The scale maxes at 0.7, meaning some states had 70% of Biden-tagged tweets classified as positive.